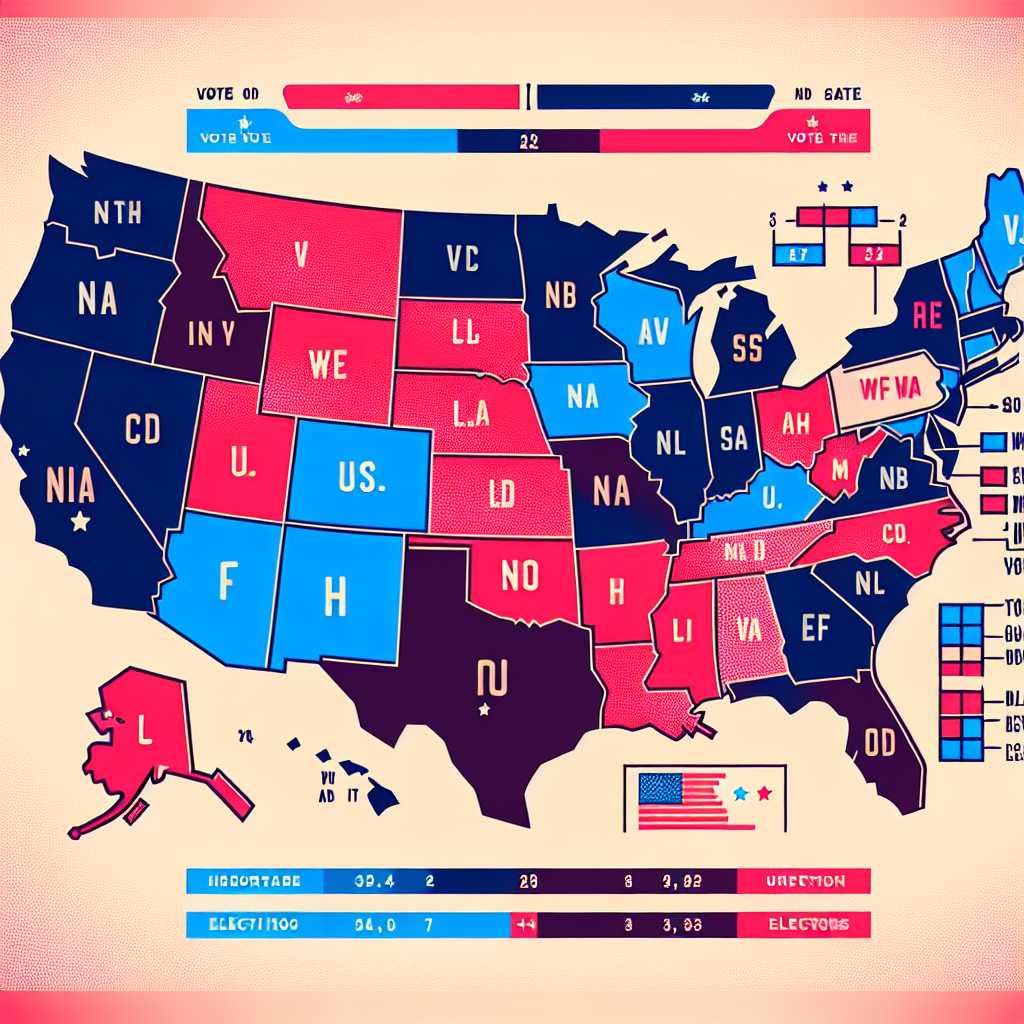
Understanding the Electoral College Map: A Comprehensive Guide
The United States Presidential election system is a complex and unique process that has evolved over the country’s history. Central to this process is the Electoral College map, a visual representation of the electoral power each state holds in electing the nation’s President. Despite being subject to criticism and numerous debates, the Electoral College remains a fundamental aspect of American democracy. This comprehensive guide will delve into the various components, functions, and significance of the Electoral College map.
Origins and Purpose of the Electoral College System
The Electoral College system was established by the United States Constitution. The founders created this mechanism aiming to balance power between large and small states and to serve as a compromise between electing the President by a vote in Congress and electing the President by a popular vote of qualified citizens.
The Electoral College works by allocating a certain number of electors to each state based on its representation in Congress: one for each member in the House of Representatives (proportional to population size) and two for its senators (equal for every state). The District of Columbia is also allocated three electors, as determined by the 23rd Amendment.
The overall purpose of this system is to ensure that states have a somewhat proportional input into the selection of the President while also mandating that to win, a candidate must achieve substantial support across geographically and demographically diverse regions.
How Does the Electoral College Map Work?
Each state’s electoral votes are represented on the map with varying colors, generally blue for Democrats and red for Republicans. After each presidential election cycle, changes in population recorded by the decennial census may shift electoral votes among states in a process known as reapportionment.
Typically, each state holds a winner-take-all system, where the candidate receiving the most votes wins all of that state’s electoral votes, except Nebraska and Maine, which divide their electoral votes proportionally.
The candidate who reaches or surpasses the threshold of 270 out of a total of 538 electoral votes becomes the next President of the United States.
Battlegrounds and Swing States On The Map
Certain states have a relatively even split among Democratic and Republican voters; these are known as swing states or battleground states. They are particularly important as they can often determine an election’s outcome. Substantial campaigning resources are invested in these states, making them crucial targets as depicted on an electoral map.
Key swing states often include Florida, Pennsylvania, Ohio, Michigan, Wisconsin, Arizona, North Carolina, among others—though this list can change with political climate. The electoral map highlights these with neutral colors or dual shading to indicate their potential to swing either way.
The Role of Faithless Electors
A “faithless elector” refers to an elector who does not cast their electoral vote for the candidate they pledged to support. Though rare, faithless electors have occurred in several elections and can cause changes to what might be expected from the electoral college map results.
Legal ramifications occur in some states which discourage being faithless by enforcing fines or disqualifying votes, keeping most electors faithful to their pledge.
Criticism and Calls for Reform
Despite its long-standing role in U.S. politics, there have been many criticisms leveled at the Electoral College system—pointing out that it may result in disproportionate influence for smaller states or discounts individual votes. Critics emphasize instances where candidates won the popular vote but lost in electoral votes (2000 and 2016 elections).
Reform suggestions range from abolishing it entirely in favor of a direct popular vote to modifying it through legislation like the National Popular Vote Interstate Compact (NPVIC), which is aimed at ensuring that electoral votes reflect the outcome of the national popular vote without eliminating it completely.
Electoral College Map and Its Implications
While it may seem merely geographical or statistical representation, the electoral college map fundamentally encapsulates America’s political landscape. Responding to demographic shifts and changing political sentiments, this evolving picture can at times influence campaign strategies and voter turnout efforts.
Notes
Image description: A stylized graphic showing an electoral map of the United States. Each state is color-coded either blue or red according to its voting record in a recent election cycle. Swing states are shown in purple with dashed lines indicating their undecided status. Key statistics like total elector numbers are superimposed on the side with arrows pointing toward their corresponding states on the map.
